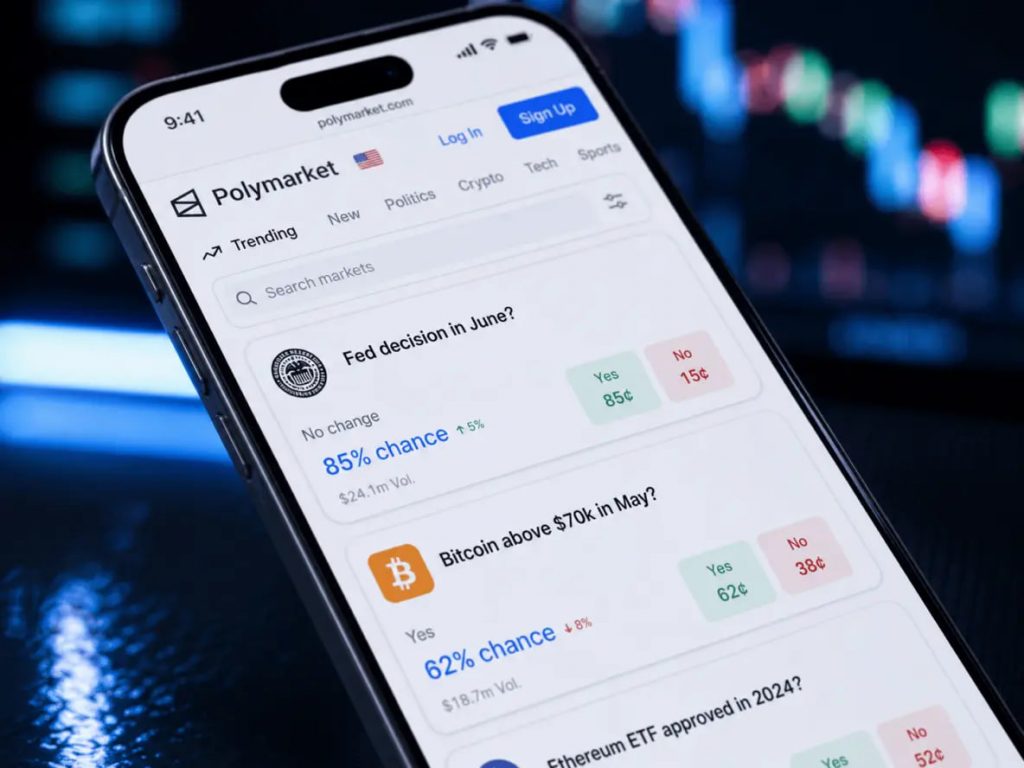
Polymarket’s own interface shows a market’s total volume, but that figure comes from the matching engine, not straight from the blockchain. Anyone who wants to check the real trade history needs a separate source. A polymarket dune dashboard does exactly that: it reads every transaction directly off Polygon and rebuilds the numbers independently, with no login and no app in between.
What a Dune Dashboard Actually Is
Dune is a data platform that lets anyone query public blockchain data with SQL and turn the results into charts. Polymarket settles every trade on Polygon, so its full trading history sits on a public ledger that anyone can read. Dune built a dedicated schema for that data, which means the raw trades, balances, and positions are already organized and ready to query without writing complex code.
Dune’s own documentation names this the polymarket_polygon schema, and it covers everything from individual trade events to hourly open-interest snapshots. The tables refresh on their own, so a dashboard built on top of them stays current without anyone manually pulling new numbers.
The Three Numbers Worth Tracking
Polymarket’s own developer documentation points new users toward three starter queries: trading volume, total value locked, and open interest. Volume measures how much USDC has changed hands on a given market. TVL tracks how much USDC currently sits locked inside Polymarket’s smart contracts. Open interest estimates how much money is still active in markets that haven’t resolved yet.
Those three numbers cover the whole picture. Volume shows activity, TVL shows money at rest, and open interest shows money still at risk.
Dashboards Worth Bookmarking
Nobody needs to write a query to get value out of this. A handful of public dashboards already track Polymarket around the clock, and anyone can open them for free without a Dune account.
- rchen8’s original Polymarket dashboard — one of the earliest trackers, running since before most traders had heard of the platform.
- A volume and open-interest dashboard built by Dune contributor hildobby, which breaks activity down by market category, wallet address, and time period.
- Dedicated daily open-interest and volume queries that update automatically, useful for checking whether a market’s reported size is backed by broad trading or by a handful of large wallets.
Each one pulls from the same underlying schema, so the headline numbers rarely disagree between dashboards. They mostly differ in how the data gets filtered and displayed.
How to Open One Without Writing a Query
Opening a finished dashboard takes no technical skill at all. Searching a creator’s username on Dune, like rchen8 or hildobby, brings up their public work directly, and every chart is already built and labeled. Viewing is free and doesn’t require creating an account.
Anyone who wants to filter by a specific market or date range can clone an existing dashboard’s query with one click and edit the SQL, even with only a loose grasp of the syntax, since most queries are short and clearly commented. That one step is the difference between browsing someone else’s chart and pulling a custom answer for a specific question.
A Practical Use Case
Say a market’s volume jumps overnight and gets cited in a headline somewhere. The Polymarket app will show the new total, but it won’t show who moved it. Pulling the same market’s trade history on Dune shows whether that spike came from dozens of separate wallets or from one or two large trades passing through — a distinction that changes how much weight the number deserves.
That kind of check matters most around high-volume events, where a single large trade can make a market look far more actively traded than it is.
What Dune Can’t Tell You
Dune only sees what already settled on-chain. It won’t show a live order book, a current bid-ask spread, or who is about to get filled next — our breakdown of market depth and why the displayed price isn’t always the execution price covers that side of pricing in detail.
It also won’t flag which individual wallets are actually profitable over time, since profit depends on entry and exit prices, not just trade counts. That kind of research fits better with our guide to reading leaderboards and tracking specific wallets, which draws on Polymarket’s own activity feed rather than raw chain data.
Who Should Actually Use This
Someone checking a single market’s current price doesn’t need any of this. Dune earns its place when someone needs to verify a volume claim, trace a wallet’s full trading history, or build a custom chart instead of trusting a screenshot posted somewhere else.
Journalists and researchers covering Polymarket already treat these dashboards as a baseline, since the numbers can be checked independently of the company that runs the platform. They’re free, require no Polymarket account to view, and the underlying tables update roughly every hour, which is close enough to real time for almost any research question a casual reader would ask.